作者介绍
@Tom&Jerry
“数据人创作者联盟”成员。
1.1 描述单个数据集
描述数据集简单的方式就是用列表去描述:num_friends = [100, 99, 41, 25]
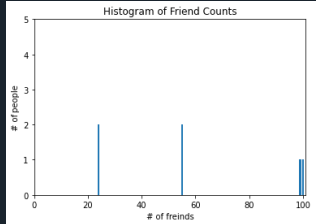
# -*- coding: utf-8 -*-"""Spyder EditorAThis is a temporary script file."""from collections import Counterimport matplotlib.pyplot as pltnum_friends = [100, 55, 99, 24, 24, 55]friend_counts = Counter(num_friends)xs = range(101)ys = [friend_counts[x] for x in xs]plt.bar(xs, ys)plt.axis([0, 101, 0, 5])plt.title("Histogram of Friend Counts")plt.xlabel("# of freinds")plt.ylabel("# of people")plt.show()
1.2 中心倾向
# -*- coding: utf-8 -*-"""Spyder EditorAThis is a temporary script file."""from typing import Listdef quantile(xs:List[float], p:float) -> float:p_index = int(p * len(xs))return sorted(xs)[p_index]print(quantile([1, 3, 4, 1, 2], 0.25)) #1
# -*- coding: utf-8 -*-"""Spyder EditorAThis is a temporary script file."""from typing import List,Counterdef mode(xs: List[float]) -> List[float]:"""因为众数可能有多个,所以需要返回一个列表"""counts = Counter(xs)max_counts = max(counts.values())return [x_i for x_i, count in counts.items() if count == max_counts]print(mode([1,2,3,41,1,2])) #[1, 2]
1.3 离散度
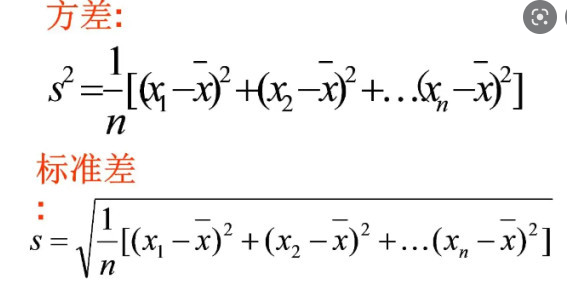
# -*- coding: utf-8 -*-"""Spyder EditorAThis is a temporary script file."""from typing import Listfrom statistics import meanimport mathdef decline_mean(x: List[float]) -> List[float]:x_mean = mean(x)return [x_i - x_mean for x_i in x]def sum_of_squares(x: List[float]) -> float:list_squares = [x_i * x_i for x_i in x]return sum(list_squares)# 计算方差def variance(xs: List[float]) -> float:n = len(xs)deviations = decline_mean(xs)return sum_of_squares(deviations) / (n - 1)# 计算标准差def standard_variance(xs: List[float]) -> float:return math.sqrt(variance(xs))print(variance([1,2,3,4])) #1.6666666666666667 方差print(standard_variance([1,2,3,4])) #1.2909944487358056 标准差
# -*- coding: utf-8 -*-"""Spyder EditorAThis is a temporary script file."""from typing import Listdef quantile(xs: List[float], p: float) -> float:p_index = int(p * len(xs))return sorted(xs)[p_index]def interquartile_range(xs: List[float]) -> float:return quantile(xs, 0.75) - quantile(xs, 0.25)print(interquartile_range([1, 3, 4, 1, 2])) #2
1.4相关
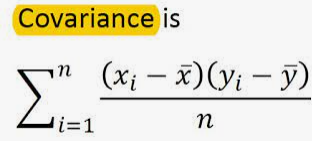
from typing import Listfrom statistics import meanVector = List[float]def covariance(xs: List[float], ys: List[float]) -> float:assert len(xs) == len(ys), "must have same number of elements"return dot(decline_mean(xs), decline_mean(ys)) / (len(xs) - 1)def dot(v: Vector, w: Vector) -> Vector:# 判定长度是否相同assert len(v) == len(w), "vector have same length"return sum(v_i * w_i for v_i, w_i in zip(v, w))def decline_mean(x: List[float]) -> List[float]:x_mean = mean(x)return [x_i - x_mean for x_i in x]print(covariance([1,2], [2,3])) #0.5
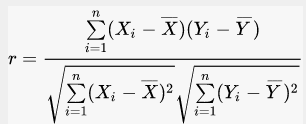
协方差的单位是 朋友量/分钟/天,这很难理解; 如果每个用户朋友数是之前两倍,分钟数不变;但从某种意义上,变量的相关度是一样的;


发表评论 取消回复